Graph View Screen
This chapter describes the functions of the graph view screen.
For specific examples of how to create and execute workflows, see Tutorial.
The graph view screen is organized as follows.
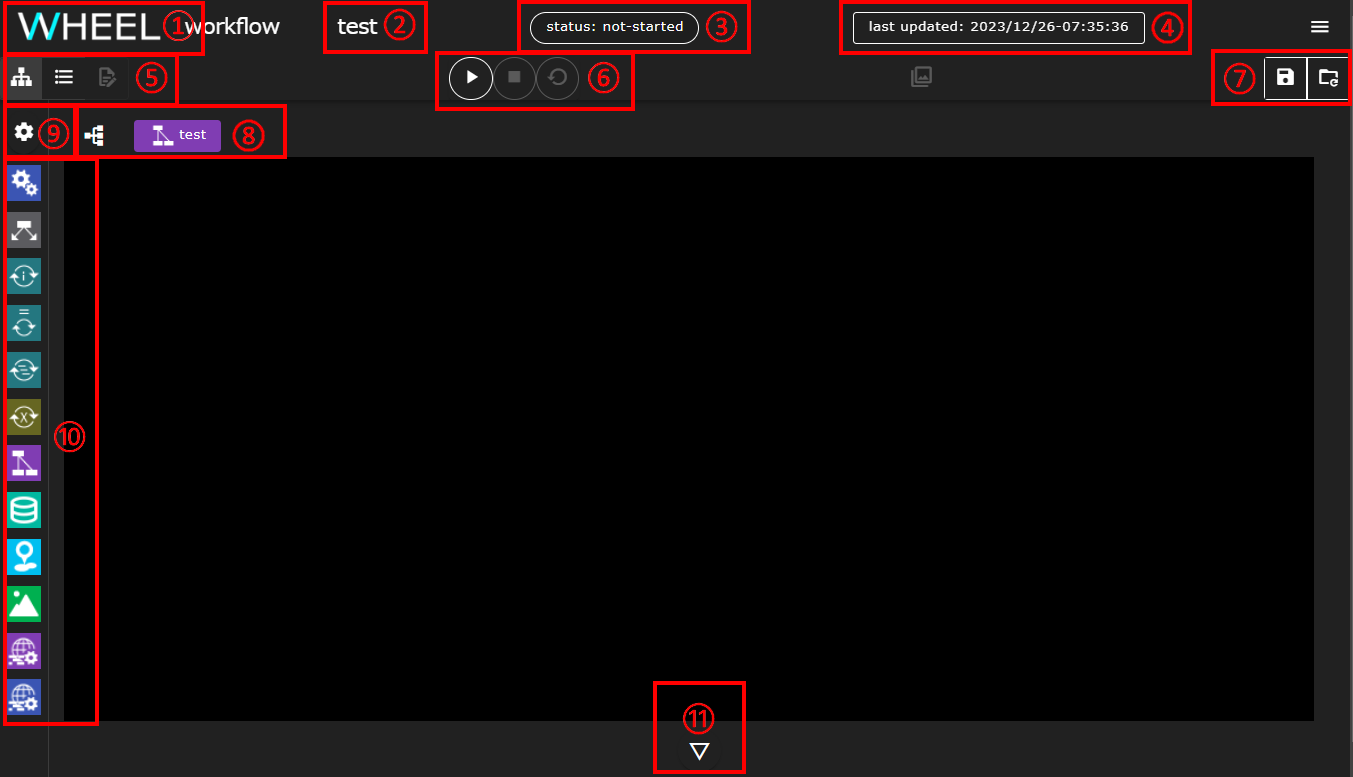
| Component | Description | |
|---|---|---|
| 1 | Title (WHEEL) button | Go to the Home screen |
| 2 | Project Name Area | Displays the name of the project being edited in the workflow. |
| 3 | Status display area | Displays the STATUS (execution status) of the project. |
| 4 | Edit date and time display area | Displays the date and time the project was created and updated. |
| 5 | Workflow Screen Switching Button Area | Displays buttons for switching the workflow screen to Graph View, List View, or Text Editor |
| 6 | Project Operation Buttons Area | Displays the Run, Stop, and Clean Project buttons. |
| 7 | Save button area | Validate project, Save Project, Discard Changes button appears. |
| 8 | Hierarchy display/transition button | Displays the hierarchy of the currently displayed component |
| 9 | Environment variable editor display button | Environment variable setting screen is displayed. |
| 10 | Component Library | Palette for adding components that are components of a workflow |
| 11 | Log display button | Displays logs about the creation and execution of the workflow. |
About Connection Status Icon Next to the hamburger menu in the upper right corner of the screen, an icon indicates the connection status with the server.
- Green icon: Connected to server
- Red icon: Disconnected from server
When the connection status changes, a toast message is displayed.
The following describes each area and button in detail.
Status display area
The status display area shows the following statuses depending on the execution status of the entire project:
- not-started: Before project execution
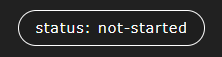
- preparing : Preparing for Project Execution
- running : Project running

- stopped : Project execution stopped

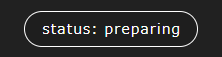
- finished : Project Finish (Normal Finish)
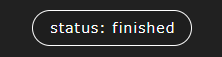
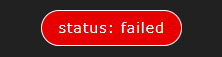
- failed : End Project (Error occurs)
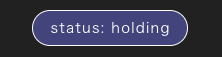
- holding : Checking for jobs with unknown execution status
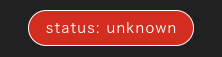
- unknown : Job with unknown execution status
About holding After checking the execution status of submitted jobs was interrupted during project execution due to a restart of the WHEEL process, the execution status of jobs is checked when the project is opened. In this state, no project operations are accepted, but as soon as the job status check is completed, other states such as stopped/finished/failed/unknonw are transitioned.
About unknown The status changes to unknown when an error occurs more than the specified number of times when checking the execution status of a job submitted by WHEEL. Move from the root workflow to the lower components to find the task components that are in the unknown state and check whether the execution status of the job has any effect on the success or failure of the entire workflow.
Project Operation Button Area
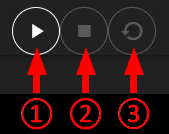
This area displays the buttons involved in running the project.
| Component | Description | |
|---|---|---|
| 1 | run project button | Start running the project |
| 2 | stop project button | Stops project execution and returns to the state before execution |
| 3 | cleanup project button | Deletes files generated during project execution and returns to the state before execution |
Save button area
This area contains buttons for saving edited projects.
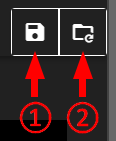
| Component | Description | |
|---|---|---|
| 1 | validate project button | Validate project integrity |
| 2 | save project button | Save project |
| 3 | revert project button | Revert project to previous save state |
About save project button/revert project button behavior
WHEEL uses git for file history management.
Your edits on the graph view screen are immediately reflected in the server-side file, but are not registered in the git repository until you click the save project button.
Click the revert project button to discard all changes made since the last commit and return the repository to the state it was in when it was last committed.
For more information about git operations, see the developer documentation detailed design document.
Workflow screen changeover button area
This area displays buttons that switch the workflow screen between graph view, list view, and text editor.
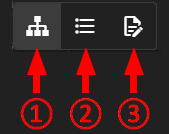
| Component | Description | |
|---|---|---|
| 1 | graph view button | Switches to the graph view screen. The graph view screen is the initial screen |
| 2 | list view button | Switch to the list view screen |
| 3 | text editor button | Switch to the text editor screen |
About Transitions to Text Editor Screens Transitions to the text editor screen are limited by the selected state of the file or the selected state of the project. If the transition cannot be made, the text editor button is displayed in a state that cannot be clicked.
Hierarchy display/transition buttons
A workflow has a hierarchical structure of components, but you can only view components in the same hierarchy at the same time on the graph view screen.
The hierarchy display area shows the position of the currently displayed component down the hierarchy from the root component of the project.
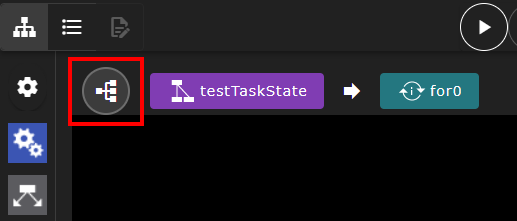
In addition, click the tree view button at the left end of the hierarchy display area to display the hierarchy of the entire project.
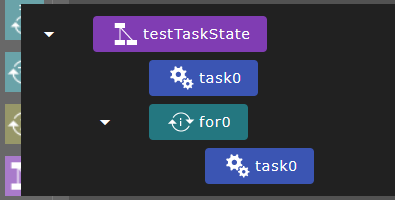
In both views, clicking a component switches the view to the displayed component.
Environment Variable Editor Display Button
Click this button to display a screen for setting environment variables that can be used, for example, in shell scripts that run in the project.
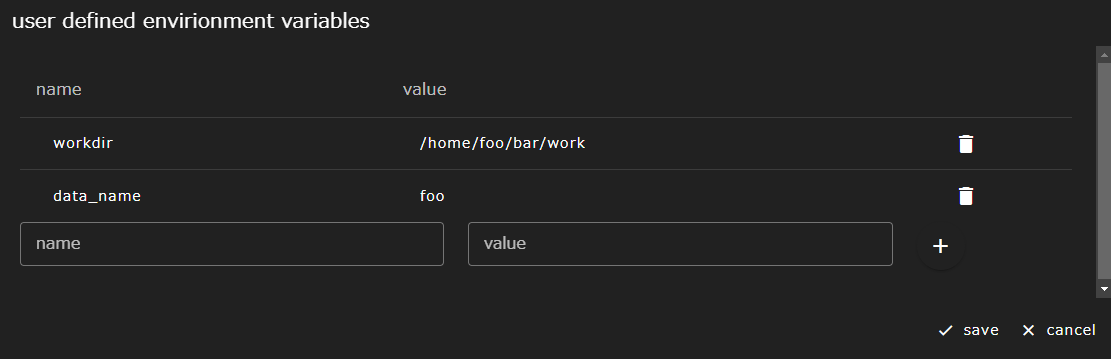
- Create environment variables You can add a new environment variable by entering the environment variable name in name and the value in value and clicking the + button.
- Edit environment variables You can change it by clicking the environment variable name or value in the environment variable row you want to edit.
- Delete environment variable You can delete a previously set environment variable by clicking the trash can icon at the right end of the environment variable row that you want to delete.
After changing the settings, clicking the save button will actually take effect. Click the cancel button to discard your changes and exit.
Workflow Creation Area
Displays the child components of the currently displayed component. Initially, the child components directly under the root component of the project are visible.
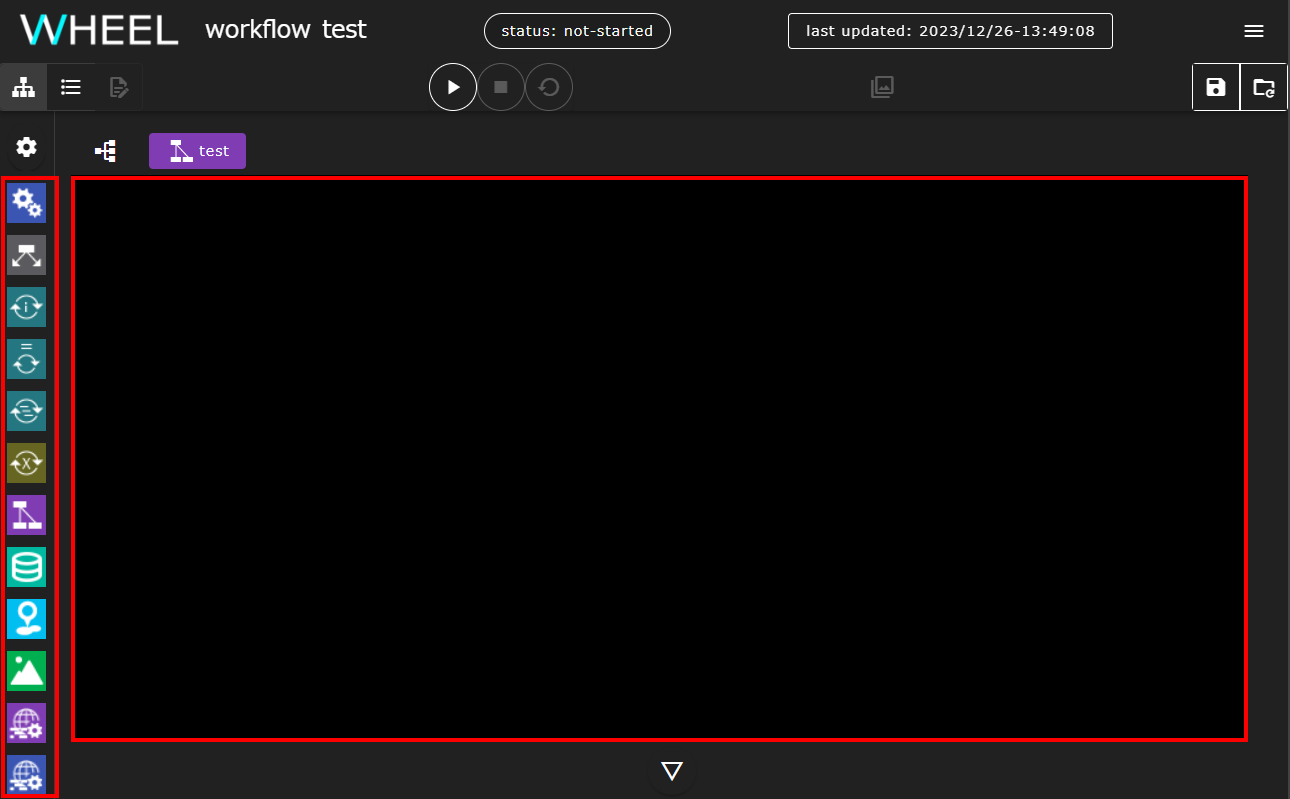
In this area, drag and drop components from the component library to add them to your project.
Double-click a visible component to switch to display its subcomponents.
To switch to a higher component, use the hierarchical display or component tree described above.
Copy, Cut, and Paste Components
You can select a component and use the following keyboard shortcuts to copy, cut, and paste:
- Ctrl+C (⌘+C on Mac): Copy the selected component
- Ctrl+X (⌘+X on Mac): Cut the selected component
- Ctrl+V (⌘+V on Mac): Paste the copied or cut component at the mouse cursor position
- Esc: Clear copy/cut status
Copied or cut components are displayed with a red border. Cut components are displayed with a dashed border.
You can also right-click a component to access copy and cut operations from the context menu.
Zoom Feature
You can adjust the.
- ペースト: 事前にコピーまたはカットしたコンポーネントをカーソル位置にペーストします(コンポーネントがコピー/カットされている場合のみ表示)
- インポート: コンポーネントアーカイブファイル(.tgz)を現在のワークフローにインポートします
ログ表示ボタン
ワークフローの作成時や実行時等に出力されるログを表示します。
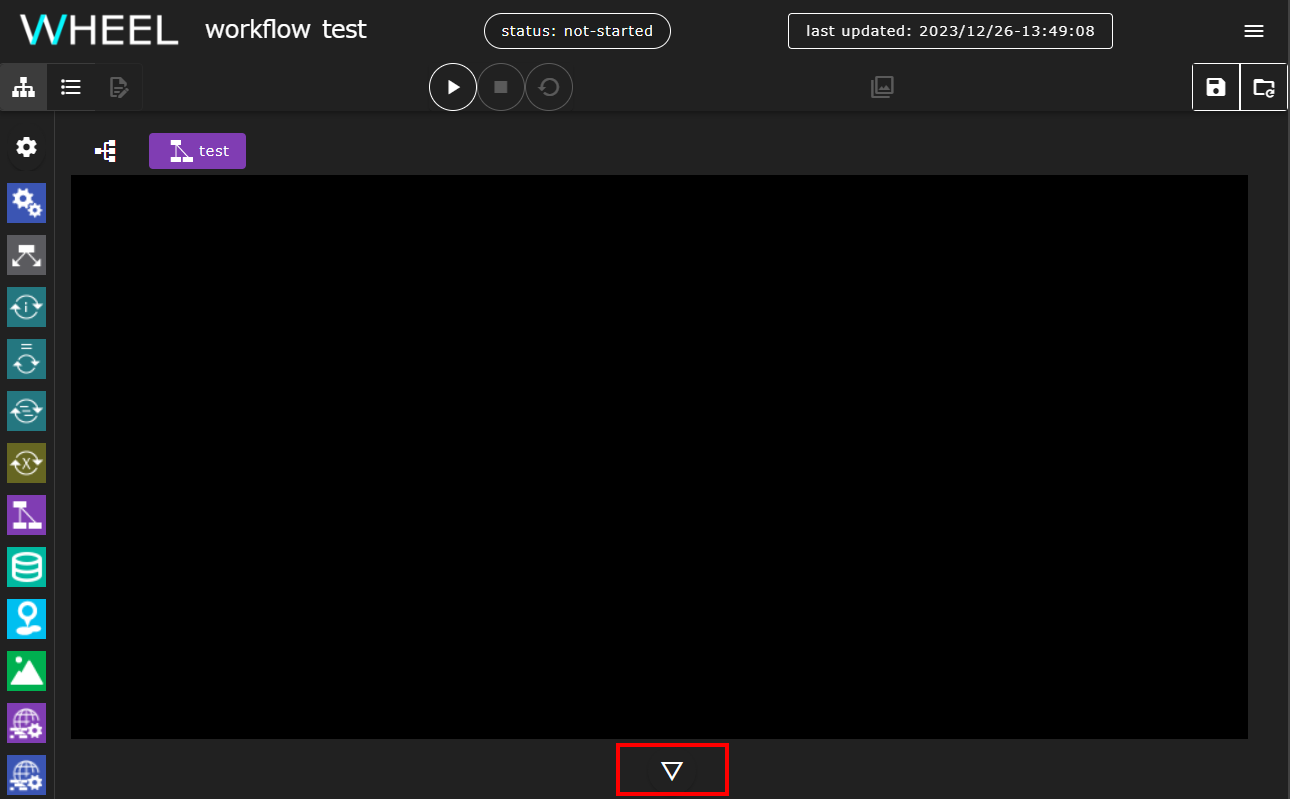
ボタンをクリックすると、次のようなログ表示エリアが表れます。
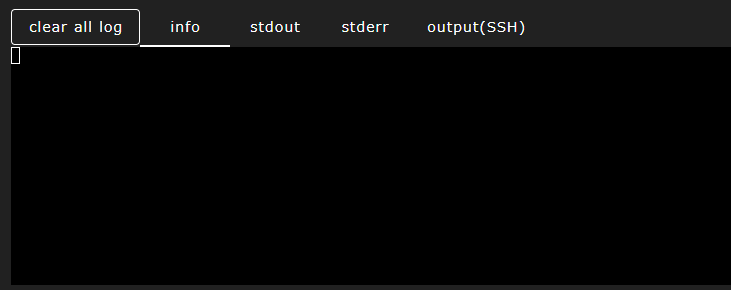
ログ表示エリアには以下の機能があります。
| 構成要素 | 説明 | |
|---|---|---|
| 1 | clear all log ボタン | それまでに表示された全てのログが消去されます |
| 2 | category ボタン | 表示するログのカテゴリをフィルタリングできます |
| 3 | download debug ボタン | デバッグ用のログファイルをダウンロードします |
カテゴリフィルタ
category ボタンをクリックすると、表示するログのカテゴリを選択できます。 カテゴリは以下のように分類されています。
- system: info, warn, error - システムメッセージやプロジェクトの実行状況に関する情報
- script: stdout, stderr, sshout - スクリプトの実行結果
- stdout: ローカルホストで実行されたタスクの標準出力
- stderr: ローカルホストで実行されたタスクの標準エラー出力
- sshout: リモートホストで実行されたタスクの標準出力および標準エラー出力
各カテゴリのチェックボックスをオン/オフすることで、表示するログをフィルタリングできます。
最上部の△ボタンをクリックすると、ログ表示エリアが下部に折り畳まれます。